The Dual Continua of VG/AH Theory
To begin with, it would useful to include a discussion of the difference between a Continuously Distributed Random Variable (CDRV) and a Discretely Distributed Random Variable (DDRV). Let’s consider a concrete example - the following is real data taken from a random sample of 5738 adult American males:
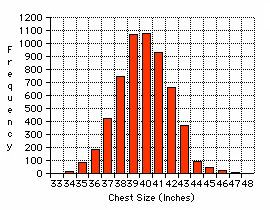
| Chest Size (in Inches) | 33 | 34 | 35 | 36 | 37 | 38 | 39 | 40 | 41 | 42 | 43 | 44 | 45 | 46 | 47 | 48 |
| Number of subjects with above chest size |
3 | 18 | 81 | 185 | 420 | 749 | 1073 | 1079 | 934 | 658 | 370 | 92 | 50 | 21 | 4 | 1 |
Let’s look at a bar graph of the data:
This can also be represented using a line graph:
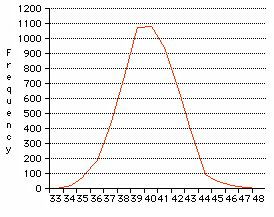
Notice that the graph is not totally smooth and symmetric. In the above example, the chest size values run - in increments of one inch - from 33 to 48. The number of subjects in each category - corresponding to each chest size - runs from 1 to 1079. Both of these variables are discrete because they each attain finitely many values.
Because of the whole-number values in the above example, I assume that the measurements were made to the nearest whole inch. The graph can be progressively “smoothed out” by making measurements to the nearest half-inch, say, and continue refining it. Theoretically, this process can be extended indefinitely. (In the language of Calculus, we say that “the norm of the partition approaches zero”)
The most important difference between the two types of RVs is the number of possible values the RV can assume. The DDRV can assume finitely many values, whereas a CDRV can assume infinitely many values (actually, that is not quite right, but the distinction is not important to this discussion). An example of a DDRV is gender - the test subject can assume only one of two (i.e., finitely many) values. An example of a CDRV is Chest Size.
Observe that, because of the limitations in measuring and the discrete nature of natural phenomena, certain CDRVs, such as chest size, can assume only finitely many values. For example, provided we could measure to such accuracy, we could determine the precise chest size down to a molecule (“My chest is one molecule bigger than yours!”), and no further. However, by a variation of the Central Limit Theorem, as the number of values of of a naturally occurring phenomena grows without bound (“approaches infinity”), the DDRV becomes a CDRV and, in fact, a Normal CDRV. The Normal CDRV is the distribution associated with the so-called “Bell Curve”.
According to the first formulation of VG/AH Theory, one was classified by the amount of visual information processed by the brain or, in other words, the relative closure of the “Visual Gate”. Plausibly, there are many factors that can affect this level - some biological, some environmental. Let us assume that there is an objective measure - such as an electrochemical potential or a visual perception test - which can determine the biological factor independent of any environmental factor.
We will assume the Visual Gate is an objectively (i.e., chest size), and not subjectively (i.e., IQ score or VG/AH Survey 23) determined CDRV. In the first formulation of this continuum, the AH lies on one end of the continuum, and the VG on the opposite end. Anecdotally, VGs outnumber AHs by a factor of anywhere from 3:1 to 7:1, therefore the visual gate CDRV will not be normally distributed - as is the case for chest size - and instead be skewed towards the VG end.
So where does the AI (Agricultural-Industrialist) fall on this distribution? By definition, at the (weighted) average value. However, it is equally acceptable to claim that the AI resides at the median value or even the numerical average of the endpoint values. I assert that it doesn’t really matter to which the AI is assigned, since all values in the vicinity of the median or weighted mean will have members whose characteristics - relative to visual gate closure - are very similar. In truth, it is pointless to try to assign a single value for the AI because the probability is zero that a CDRV achieves a single (discrete) value. Thus, the AI represents a range of values which likely include the (value of which is represented by the) maximum point of the distribution curve, the median, and the weighted average value.
In Thom Hartmann’s model - based on the so-called “thalamic gain” - he places his Hunters (low gain) on one end, and his Farmers (high gain) on the other. The problem with his conceptualization is that we have found numerous examples of people with ADD/ADHD who seem to lie at opposite extremes of the thalamic gain distribution. The question arises as to whether the Visual Gate, which is merely a special case of Hartmann’s Thalamic Gain conceptualization, is the only possibility. We chose the Visual Gate because vision is the richest of the five senses, given that so many nuances in difference can be discerned. However, there is another extremely important sense which is often not considered because it’s existence is generally not accepted - the so-called “6th Sense”, also known as the “Empathic Sense” or “Animal Sense”
Now let’s introduce a new scale for measuring AH-ness and VG-ness. First, let me draw an analogy with height (as a genetically inherited feature). I’m making the following numbers up for my convenience - please don’t read too much into it. Say we have a male who stands 71 inches (5’ 11”) in height, and for simplicity, let’s presume that this puts him in the 70th percentile for height. In other words, out of every 100 adult males, our test subject will be at least as tall as 70 of them.
Let’s breed him with a female who stands at 69 inches (5’ 9”). Again, for arguments sake, let’s say that the woman is in the 80th percentile for height, which is entirely plausible. Observe however, that percentile for height has different meanings for each gender. This is summarized in the following diagram (where the offspring are denoted by triangles):
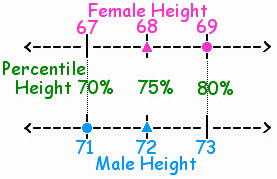
We can then say that the female is “80% tall” and the male is “70% tall”, where “percentage tallness” does not have identical meaning for the two genders. Due to a variation of a phenomenon called “Regression to the Mean”, the highest probability is that the offspring will be somewhere between 70% tall and 80% tall. In other words, the heights blend, much the way skin pigmentation does - a light-skinned man and a dark-skinned woman will have children whose skin color is somewhere in between.
However, our test couple may very well have a daughter who is 68 inches (5’ 8”) and a son who is 72 inches (6’). Thus, it would appear that the heights of the offspring don’t conform to regression to the mean, because the daughter is shorter than both parents and the son is taller than both parents - it doesn’t appear that the heights are blending. If you didn’t know that men tend to be taller than women, this would seem to be somewhat paradoxical. However, when you look at it in terms of percentiles, it is quite plausible that the height (adjusted with respect to gender) CDRV regresses to the mean. For example, at the above stated heights, both son and daughter could be 75% tall, which is a percentile value between the 80% tall mom and the 70% tall dad.
Let’s extend this analogy to AH and VG. When we say that someone is 80% VG, meaning (subjectively) that their symptoms of ADD/ADHD are more severe than 80% of all VGs. Height - relative to gender - is a good analogy, because the 2 genders are distinct, as are the 2 types, AH and VG. In other words, you can be AH or VG, but not both - just like gender.
Also, realize that because of the fact that AHs and VGs display the severity of their symptoms differently - the AH usually shows it and VG usually hides it - a 70% AH can very well appear to have more severe symptoms than a 80% VG - again, these numbers were just chosen for simplicity of illustrating my point.
What I seem to have discovered is that, in parents, the “percentile of AH-ness” interacts with the “percentile of VG-ness” in a way analogous to the way height does in the genders. So, if I am a 70% AH, and I breed with a 80% VG female, my 2 daughters likely could be 75% VG and 75% AH, for example. This means that my AH-daughter will most likely appear “worse” (i.e., more severe symptoms of ADD/ADHD) than I do, and my VG-daughter will appear “better” (less severe symptoms of ADD/ADHD) than her VG mom. In fact, I have seen several examples of this - such as in our family - and, if this were established in the general population, this would demonstrate that VG and AH are as distinct as gender.
Given that a common estimate is that 5% of the general population is ADD/ADHD diagnosable, this would mean that the majority of people would be near the middle of the continuum, that is, AIs. Our Visual Gate continuum - with AHs and VGs on the opposite (“skinny”) ends of the curves - fits this estimate of the percentage of ADD/ADHD diagnosable in the general population. However, there is an apparent flaw with this conceptualization - it does not hold up empirically. Our experience - with a sample size approaching a few hundred, many of whom have not been formally diagnosed as ADD/ADHD - is that nearly all our test subjects can be classified as either VG or AH, provided we have enough information to make the determination.
Let’s return to the example of height and genders. What would happen if we were to look at a huge population (hundreds of millions) consisting of comparable numbers of men and women, and construct a graph of the heights? Because men tend to be taller than women, the bell curve would be somewhat flattened at the top, but not very much so, since the average height of men and women don’t differ by much. But what if the average height did differ by a significant amount?
To demonstrate this, let’s invent an example - a fictitious population of 1000 men and 1000 women, where the men are significantly taller than women. Let’s say that the average height of the women is only 60 inches (5’), and the average height of men is 80 inches (6’ 8”). (I realize that these numbers are absurd, but I’m trying to make a point.) Furthermore, let’s assume that, for both genders, 95% of the subjects are within 10 inches of the average, that is, from 50 to 70 inches for women, and from 70 to 90. (In the language of statistics, I assumed that the Standard Deviation - for both genders - is 5 inches.)
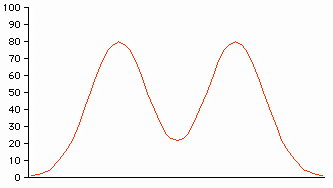
This distribution appears decidedly non-normal. The average value for height is at the “valley” between the two peaks, and these two peaks represent the average value for the women and men taken separately. Given that the normal distribution is ubiquitous in the nature world, we would conclude that we are looking at two separate phenomenon superimposed on one another. In fact, we actually are looking at two separate phenomenon, but two which are definitely linked.
The above fictitious height example seems to match the empirical evidence - of the scarcity of the AI - better than the original Visual Gate model. However, we now claim that the analogy doesn’t go far enough; even though the average heights of the men and women differ significantly, there is still considerable overlap since we are measuring the same quantity - height.
The most recent formulation of VG/AH Theory asserts that that VG and AH are distinguished by the nature of their empathic sense, which we can call an “Empathic Field”. Observe, however, that a single continuum would likewise not match the empirical evidence of the scarcity of the AI. Further, while it seems easy enough to choose the VG as having the high Empathic Gain, it is simply not correct to place the AH at the low end.
Thus, we have concluded that, for the VG, this field is mostly receptive in nature, whereas for the AH, it is mostly projective in nature. This receptive/projective nature would make the empathic sense unique among the senses. Regardless of just how projective or receptive either seems, our assertion is that both VGs and AHs have fields which have both an inward and outward component, so it makes more sense to classify them as different, not merely as the same factor but projected in different directions. In practical terms, this Empathic Field definition is difficult to work with, because there seems to be a scarcity of objective ways to measure the strength of this field.
What seems most likely is that there are two separate continua, one for VGs and a separate one for AHs. This would explain the relative scarcity of the AI in our experience. Hence, we can think of there being two separate attenuators - a switch between AH and VG, and a “volume control knob” which defines the percentile of VG-ness or AH-ness - that determine the characteristics of the individual.
To tie it all together, we must now reconcile the Dual Empathic Continua formulation with the definition of AH, namely that the AH strives to make his environment react with him. When VG/AH Theory was in its infancy (the second half of 2001), the distinction between VG and AH was best described as a collection of traits which the more common type - the VG - shared and which the AH did not share. This distinction took the form of the original Gatherer Survey, which identified the VG as one who answered positively to the more of the questions, and the AH as the opposite. But when the definition of AH was formulated in early 2002, the VG was then defined as being “not AH”. The problem with this definition of AH - as one who strives to make the environment react - is that there is no VG analogue. Given the Empathic Field definition, we now see that there was little chance that such a formulation could have been made for the VG, but this does not make the definition of AH useless or wrong.
As has been pointed out previously, such as in Essay 6, those most successful in our modern lifestyles are those who are the least negatively impacted by the nature of their Empathic Field (which includes the possibility that their Empathic Field was not relatively strong). If the Empathic Field of the AH is naturally mostly projective, then his mere presence would cause other AHs and - especially - VGs to react. But due to the cramped empathic spaces in which we live, the mere presence of the AH does not cause the reaction for which the AH strives. Thus, the AH is compelled to become more aggressive in eliciting a response, which leads to the AH often being assessed as having a “disruptive disorder”. This is especially true since the AH is not aware of their subconsciously driven behavior.
Identical and fraternal twin studies has shown that, for so-called mental disorders, there is a 50% to 60% concordance rate among identical twins, and a 30% to 35% concordance rate among fraternal twins. In other words, if one identical twin is schizophrenic, then there’s a 55% chance the the other twin is schizophrenic as well. The experts point to this as evidence that these conditions are real and have a biological basis, and yet I have always been perplexed that the concordance rate isn’t closer to 100%.
The point of all this is that, in the future, when the genetic distinction between VG and AH is determined, it will been found that there is a 100% concordance rate relative to VG/AH, just as there is relative to gender.
Return to VG/AH Theory Homepage